- We strongly recommend Windows 10/11 with the latest Service Pack installed.
- A hard disk with at least 50 Gigabytes (GB) of available space
- Microsoft DirectX 11 compatible graphics hardware
1) For a USB license, a LAN license, or a CLD license, if the SMS for that license is current, the latest version of MEscope can be downloaded from the Vibrant website and installed on any computer.
Even after SMS has expired for that license, MEscope will continue to run on the computer it was installed on.
2) For a 12-month license or a 3-month license, MEscope can only be run on the computer it was initially installed on and will stop running at the end of the license period.
For a new installation or when updating MEscope (vt######.vtl) license, copy the vt######.vtl license file into the same folder as the MEscope installation program (MEscope-Installer.exe).
Run the MEscope installation program (MEscope-Installer.exe). It will update the license and your copy of MEscope.
If you will be installing MEscope on a computer not connected to the Internet or if an error occurs while installing the prerequisites automatically, download and install the following prerequisites:
Windows 7 Users:
Windows is no longer supported by Microsoft. As a result. MEscope is no longer supporting Windows 7. We recommend upgrading to Windows 10 for optimum performance.
Download and install Console, then connect to our Cloud Database for a demonstration of MEscopeMSS Machine Surveillance Series:
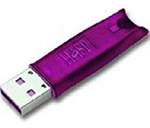
If it looks like one of these: Install HASP Driver
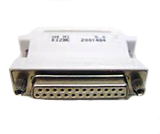

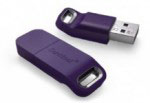
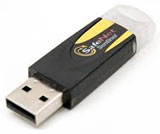
If it looks like of these: Install Sentinel Driver
- Download NetworkServer.zip
- Extract the files in NetworkServer.zip
- Follow the instructions in the PDF file to install the Vibrant License Server
NOTE: A MEscopeVES Software License can only be activated on one computer.
- Run MEscopeVES by executing All Programs | Vibrant Technology, Inc. | MEscopeVESfrom the Start Menu.
- MEscopeVES will attempt Internet Activation automatically and show a success message if no problems were encountered.
- If you are not connected to the Internet or Internet Activation fails, email your License ID and Activation ID to activate@vibetech.com. When you receive your activated license file (vt#######.vtl, where ####### is your license number), follow the instructions above to install the activated license.
NOTE: To use a cloud license, MEscope must be installed on a computer that has access to the Internet.
When prompted for a license server, cloud license users should enter 27000@vtis.vibetech.com as the license server.
The Acquisition Window and Time Waveforms use the Transmissibility and Input Auto Power Spectrum. This method does not exactly match the previous method, so the magnitude of the Output APS will no longer be the same as the magnitude of the ODS-FRF. The Output APS should be slightly higher in value due to the noise contained within the signal.
Springs, Dampers, and Masses are simple elements and only require a stiffness, damping, or mass value to be entered for them when they are added into the spreadsheet in the FEA Properties window.
Rods, Bars, Plates, and Solid elements require material properties. When they are added to the spreadsheet in the FEA Properties window, they must also reference a material property from the FEA Materials window.
All FEA elements that are added to a test article model are listed in the Structure (STR) window, in a separate spreadsheet for each type of FEA element. The spreadsheet for each FEA element must also contain a reference to one of the FEA properties in the FEA Properties window.
Download this Word document for info on writing scripts in MEscope.
The Vibrant approach to modal parameter estimation is to use several curve-fitters on the raw
data and compare the answers, rather than rely on only one curve-fitter. If the modal parameter
estimates from two or more curve-fitters are in close agreement, you will have more confidence
that your curve-fitting has yielded correct estimates.
All four different curve-fitting methods in MEscope are based on a Least-Squared-Error (LSE)
formulation between the raw data and an analytical curve-fitting model. Curve-fitting is used to
estimate the unknown modal parameters of the curve-fitting model, (frequency, damping, and
mode shape) for each resonance represented in the raw data.
The Polynomial curve-fitting method used in VT-570 was developed at Vibrant Technology and
works best in small bands surrounding each resonance peak. This algorithm relies on a Modal
Peaks Function (MPF) to determine the number of modes in a frequency band surrounding each
resonance peak in the MPF.
VT-550 has three additional curve-fitting methods which use a Stability Diagram instead of an
MPF to determine the number of modes represented in the raw data. These methods curve-fit the
raw data over a wide frequency range multiple times, using a different number of modes each
time. The modal frequency & damping estimates from all the curve-fitting solutions are
displayed on the Stability Diagram. Those estimates that are repeated in each solution are called
“stable poles” and are saved as the correct frequency & damping solutions.
Then the stable poles (or frequency & damping estimates from the Polynomial method) are used
by a second LSE curve-fitting algorithm to estimate the modal residue (mode shape component)
for each mode in each measurement of raw data.
The AF Polynomial method used with a Stability Diagram in VT-550 is most like the least
squares complex frequency domain (LSCF) method in Siemens’s TestLab. But all three curve-
fitting methods used with a Stability Diagram in VT-550 function in the same way.
The MultiRef-Polynomial and MultiRef-AF Polynomial methods weight the data from each
reference of multiple-reference raw data based on the magnitude of the resonance peaks in the
raw data.
Both impact tests will give the same results if the FRFs calculated from each test have the same pairs of
DOFs (point numbers & directions) in them.
In MEscope, each FRF must be labeled with a Roving DOF and a Reference DOF, using the format
(Roving DOF : Reference DOF).
The DOFs of the ODS’s and mode shapes are the same as the Roving DOF in the FRFs from which they
are derived.
In a Roving Accelerometer test, the Roving DOFs are the points & directions where the accelerometer is
attached to the test article, and the Reference DOF is the same point & direction where the test article is
impacted during each acquisition of data.
If a tri-axial accelerometer is used in a Roving Accelerometer test, ODS’s & mode shapes that describe
3D motion at each point are derived from the FRFs.
In a Roving Impact test, the Reference DOF is the fixed point & direction where the accelerometer is
attached to the test article, and the Roving DOFs are the points & directions where the test article is
impacted during each acquisition of data.
In a Roving Impact test, it is difficult to impact a test article in three directions at each point, so the ODS’s
& mode shapes will only contain motion of the test article corresponding to the impact DOFs.
1.Click on the rotating machine Demo project in MEscope to open it.

2. Execute File | Import | Data Block, select .CSV for the format list, and click on Open to import your CSV file.
This Demo project will help you get started constructing an STR file for your machine and getting sweep animation set up.
3. Also, you can execute Help | Start Page to import other machine STR files
A negative modal damping estimate results from a poor curve fit of the FRF data.
When negative damping occurs, use the Band cursor to surround the resonance peak
of the mode with negative damping, and curve fit the FRF data again. Several
adjustments of the curse band and/or increasing the number of modes to use for curve
fitting might be necessary to obtain all modes with positive damping.
There are several steps to displaying Mag-Phase during shape animation.
1) Select the points on the model where you want to display Mag-Phase
2) Display the selected points in the points spreadsheet
3) Click on the Display Mag-Phase column and set Mag-Phase to Yes for the selected
points
4) During shape animation, execute Deflection | Mag-Phase to display Mag-Phase at
the selected points
Only the Roving DOFs are used to create M# Links for animation in MEscope. When a
Frequency M# is calculated, both of its Roving and Reference DOF will always be
positive. All negative DOFs are removed from the source M#s before using them to
calculate the Frequency M#s.
Therefore, when a new set of Frequency M# is calculated, they must be relinked to the
DOFs on the structure model by executing the M#s Links | Create Measured
Links command.
However, if the DOFs of all the source TWFs are positive, then the current M# Links can
be used with the calculated Frequency M#s for shape animation. Otherwise, new M#
Links must be created using the M#s Links | Create Measured Links command.
ODS animation is created on a model using M# Links. Each model uses its own M#
Links to deflect its points using M#s from the current animation source. The current
animation source can be any Data Block (BLK file) or a Shape Table (SHP file) in the
currently open project (VTmax file).
An M# is the row number in the M#s spreadsheet of a BLK or SHP file. For ODS
animation to work correctly on a single model using data from different BLKs and SHPs,
they all must have the same M#s in the same order.
If ODS animation doesn’t work from a particular animation source, make a copy of the
structure model (STR file) and create new M# Links using that animation source.
Also, if ODS animation from a particular animation source doesn’t work, try
changing the amplitude speed while animating from that animation source (BLK or
SHP file).
Animation amplitude & speed are stored with each animation source (BLK or SHP
file).